
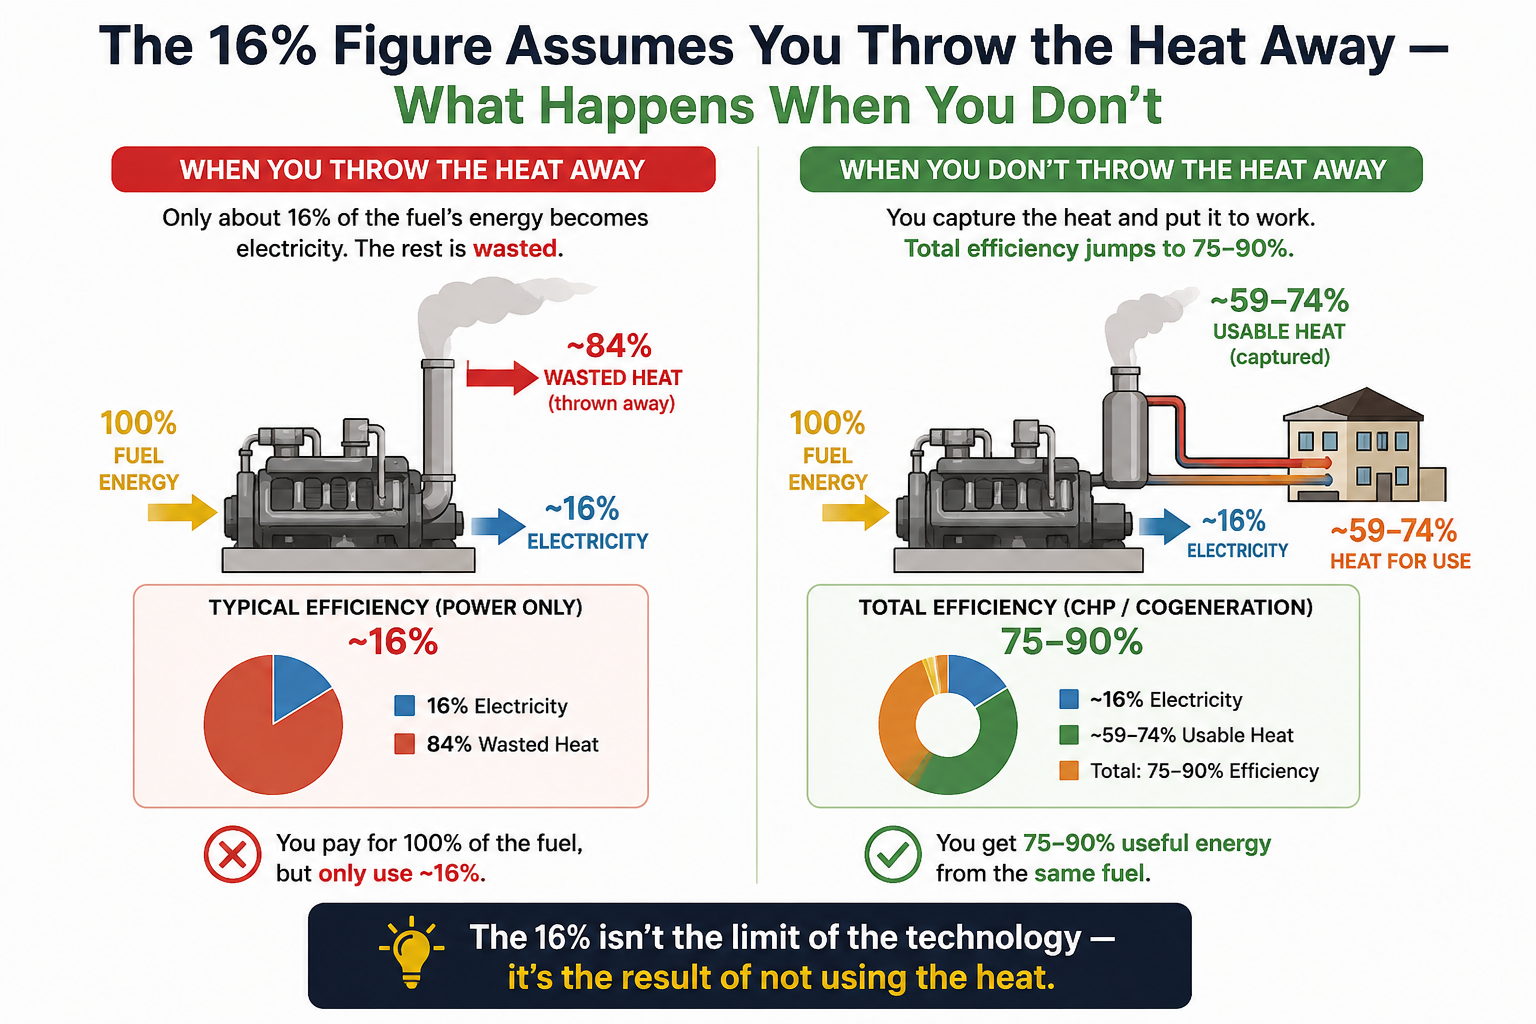

The heat nobody counts and it is not a small quantity
Fischer-Tropsch synthesis is strongly exothermic. The engineering literature is unambiguous about the magnitude: 20–25% of the syngas heating value is released as heat, and recovering it is described as necessary rather than optional — without removal the reactor cannot hold its temperature. Every commercial FT plant already extracts this heat by raising steam. The question was never whether to capture it. It is what you do with it afterwards.
Crucially, this is not low-grade waste heat. Low-temperature FT runs at 200–250°C, high-temperature FT at 320–350°C. That is medium-pressure steam — directly usable in industrial processes or a district heating network, with no heat pump and no upgrading.
| Share of syngas heating value released as heat | 20–25% |
| Temperature grade — low-temperature FT | 200–250°C |
| Temperature grade — high-temperature FT | 320–350°C |
| Documented system efficiency, FT plant in cogeneration mode | 63% |
A distinction that matters green hydrogen and white hydrogen use this heat differently
Here the two hydrogen routes diverge in a way that is rarely spelled out.
In a conventional Power-to-Liquid plant, the smartest destination for FT heat is internal: feeding a solid-oxide electrolyser, which splits steam rather than liquid water and therefore needs less electricity. One integrated design in the literature reaches 70% power-to-liquid efficiency precisely by routing FT heat into high-temperature steam electrolysis. The heat never leaves the fence line, and it is well spent.
A plant supplied with geological hydrogen has no electrolyser to feed. At first glance that looks like a lost opportunity. It is the opposite: the entire heat output becomes available for export — to an industrial neighbour, a district heating network, a drying or distillation process. Nothing internal competes for it.

The calculation deliberately conservative
What follows estimates the electricity consumed to drive 100 km on synthetic petrol, under four configurations, against a battery-electric vehicle. We have chosen conservative values at every step and we flag the weak points afterwards.
Basis: a car consuming 6 litres of e-petrol per 100 km — roughly 4.5 kg of fuel, requiring about 1.9 kg of hydrogen and 14 kg of CO₂.
| Configuration | Per 100 km | vs EV |
|---|---|---|
| Electrolysis + direct air capture The configuration the 16% figure describes | ~142 kWh | ×7.9 |
| Electrolysis + pipeline CO₂ CO₂ source changed; hydrogen still dominates | ~113 kWh | ×6.3 |
| White H₂ + direct air capture Hydrogen solved, DAC now the dominant load | ~53 kWh | ×2.9 |
| White H₂ + pipeline CO₂, heat vented Both inputs solved; synthesis is the remaining load | ~23 kWh | ×1.3 |
| White H₂ + pipeline CO₂ + heat recovered Heat credited conservatively (see method below) | ~18 kWh | ×1.0 |
| Battery-electric vehicle Grid to wheels, EU average consumption | 18 kWh | reference |
Producing 4.5 kg of fuel releases roughly 14–17 kWh of heat at 200–350°C in the synthesis reactor. There are three defensible ways to credit it, and they give very different answers.
| Generous — heat replaces a gas boiler, credited kWh for kWh | −15 kWh |
| Cautious — used here — heat replaces a heat pump at COP 3 | −5 kWh |
| Zero — no heat consumer nearby, heat vented | 0 kWh |
We used the middle method. Crediting heat against a gas boiler would flatter the result; the honest comparison, in a decarbonised system, is against the electricity a heat pump would have consumed to deliver the same heat. At COP 3, 15 kWh of delivered heat is worth 5 kWh of electricity. That is the credit applied.
What this does and does not show
1. The estimates compound. Five uncertain quantities are stacked. The ordering of the configurations is robust; the individual totals are not precision figures and should not be quoted as such.
2. Geological hydrogen extraction energy is barely documented. The ~5 kWh/kg used here is an order-of-magnitude assumption. No commercial field is producing at scale, so no operating data exist to check it against. If real extraction proves three times more energy-intensive, the last two rows move materially.
3. Everything favourable here is conditional on siting. Pipeline CO₂ requires a near-pure industrial source within reach. Heat recovery requires a heat consumer within reach. A plant with neither falls back to ~53 kWh per 100 km, or worse. This is a case for specific projects in specific places, not for e-fuels in general.
4. Parity on electricity is not parity on cost. This calculation counts kilowatt-hours, nothing else. Capital cost, hydrogen price, CO₂ price and vehicle cost are separate questions and are not addressed here.
With those limits stated, the finding stands: under the most favourable configuration the electricity gap between synthetic fuel and a battery-electric vehicle essentially closes. Not because thermodynamics changed — the conversion losses are exactly what they always were — but because two of the three large electrical loads have been removed from the chain and the third is partly recovered.


The efficiency ratio was never really about thermodynamics. It was a measure of how much scarce electricity a pathway consumes. Take the electricity out of the hydrogen, out of the carbon, and give back a fifth of the input as usable steam — and the ratio goes on measuring a loss that nobody pays for any more.
What would have to be true
| → | A certified resource — REGALOR II must confirm a commercially recoverable Lorraine deposit in 2027, and extraction energy must land near the assumed order of magnitude. Neither is established today. |
| → | A near-pure CO₂ source in reach — Ammonia, bioethanol or ethylene oxide plants produce streams at 95–99% CO₂ needing only drying and compression. Cement and steel flue gas at 10–25% costs several times more energy. The site determines the outcome. |
| → | A heat consumer in reach — Without an industrial neighbour or a district heating network, the 14–17 kWh of synthesis heat is vented and the last row of the table disappears. |
| → | Honest accounting — Crediting heat against a gas boiler rather than a heat pump would have shown parity where none exists. Method choice moves this result by a factor of three. |
None of this argues that synthetic fuel should displace electrification where electrification works. Our position on that has not moved: for a car with a charging point, the battery wins, and it will keep winning. What this analysis suggests is narrower and, we think, more useful — that the electricity argument against e-fuels is an argument about a particular production configuration, not about synthetic fuel as such. Change the configuration and the argument has to be made again on different ground.
That ground is cost, not kilowatt-hours. Which is a different article.
Nature of the figures: the per-100 km values are stacked estimates assembled from published unit values, not measurements from any operating plant. They are offered as orders of magnitude and to establish a ranking between configurations. They should not be cited as reference figures.
Weakest assumption: the energy required to extract, separate and compress geological hydrogen (~5 kWh/kg) is an order-of-magnitude assumption. No field is in commercial production, so no operating data exist. This single figure carries more uncertainty than all the others combined.
Contingent claims: FDE’s €0.50/kg target is a declared production objective, not an independently certified price. REGALOR II certification is expected in 2027 and may confirm, revise or fail to confirm the Lorraine resource.
Informational only. Not investment, legal or commercial advice. Consult primary sources before any decision. © 2026 BESS Energie SRL · BCE 0698.949.732 · e-fuels.ai